> For the complete documentation index, see [llms.txt](https://help.blings.io/llms.txt). Markdown versions of documentation pages are available by appending `.md` to page URLs; this page is available as [Markdown](https://help.blings.io/apps/blings-platform/dashboard-and-analytics.md).
# Dashboard and Analytics
Use the Platform dashboard and analytics views to monitor MP5 project performance
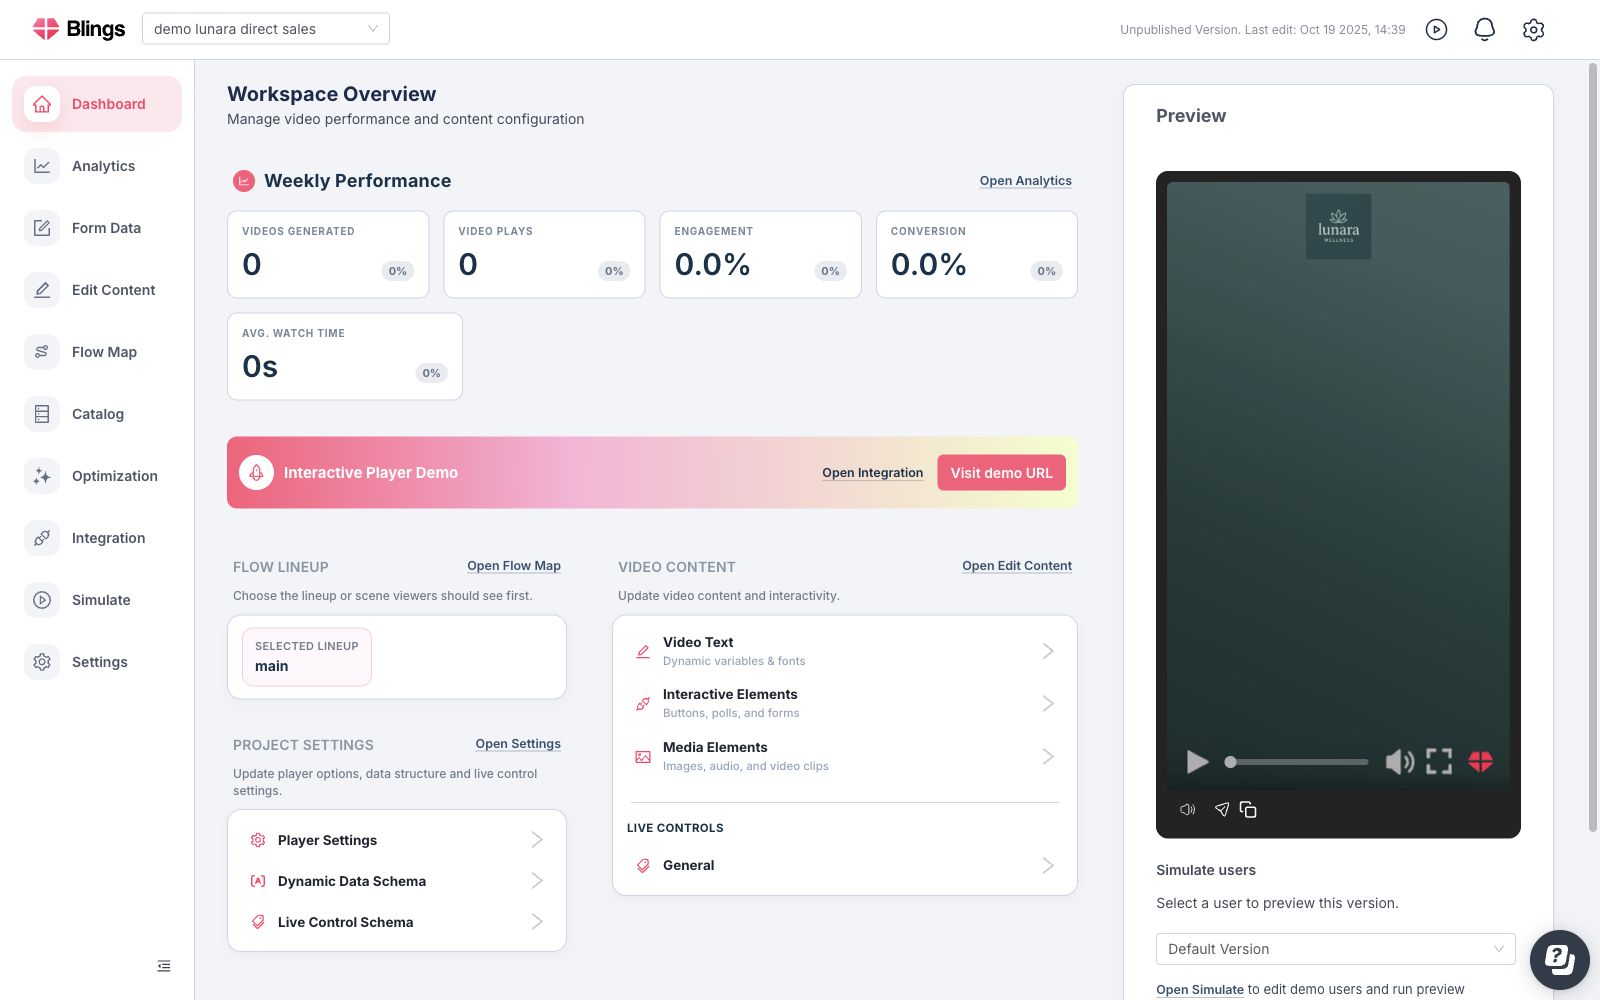
The Platform dashboard is the project landing view. It combines performance status, player preview, project shortcuts, selected lineup, content entry points, settings links, and simulation access.
{% tabs %}
{% tab title="Dashboard" %}
Use the dashboard to understand the current project state without opening every workspace area separately.
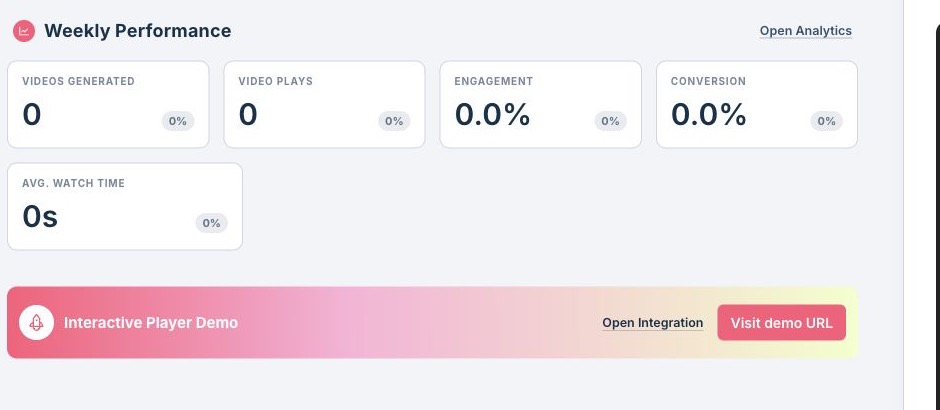
* **Weekly Performance** shows generated videos, video plays, engagement, conversion, and average watch time.
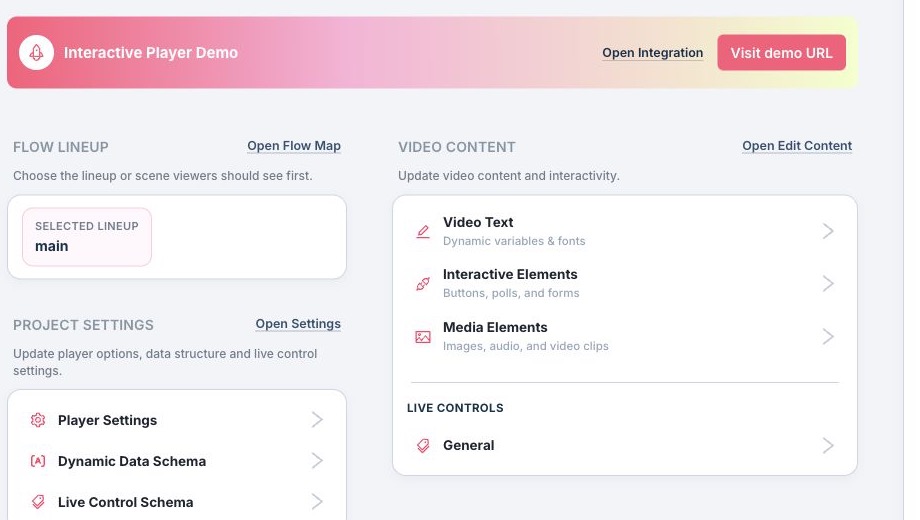
* **Interactive Player Demo** links the current project to the configured demo URL and integration setup.
* **Flow Lineup** shows which lineup is selected first for viewers.
* **Video Content** opens text, interactive, media, and live-control editing.
* **Project Settings** opens player settings, dynamic data, and live-control schema.
* **Preview** lets the current project be checked against a selected test profile.
The dashboard shortcuts are useful as an operational checklist. Flow Lineup confirms the default entry path, Video Content exposes Platform-editable copy and media, and Project Settings links directly to player behavior, data schema, and live-control configuration.
{% endtab %}
{% tab title="Analytics" %}
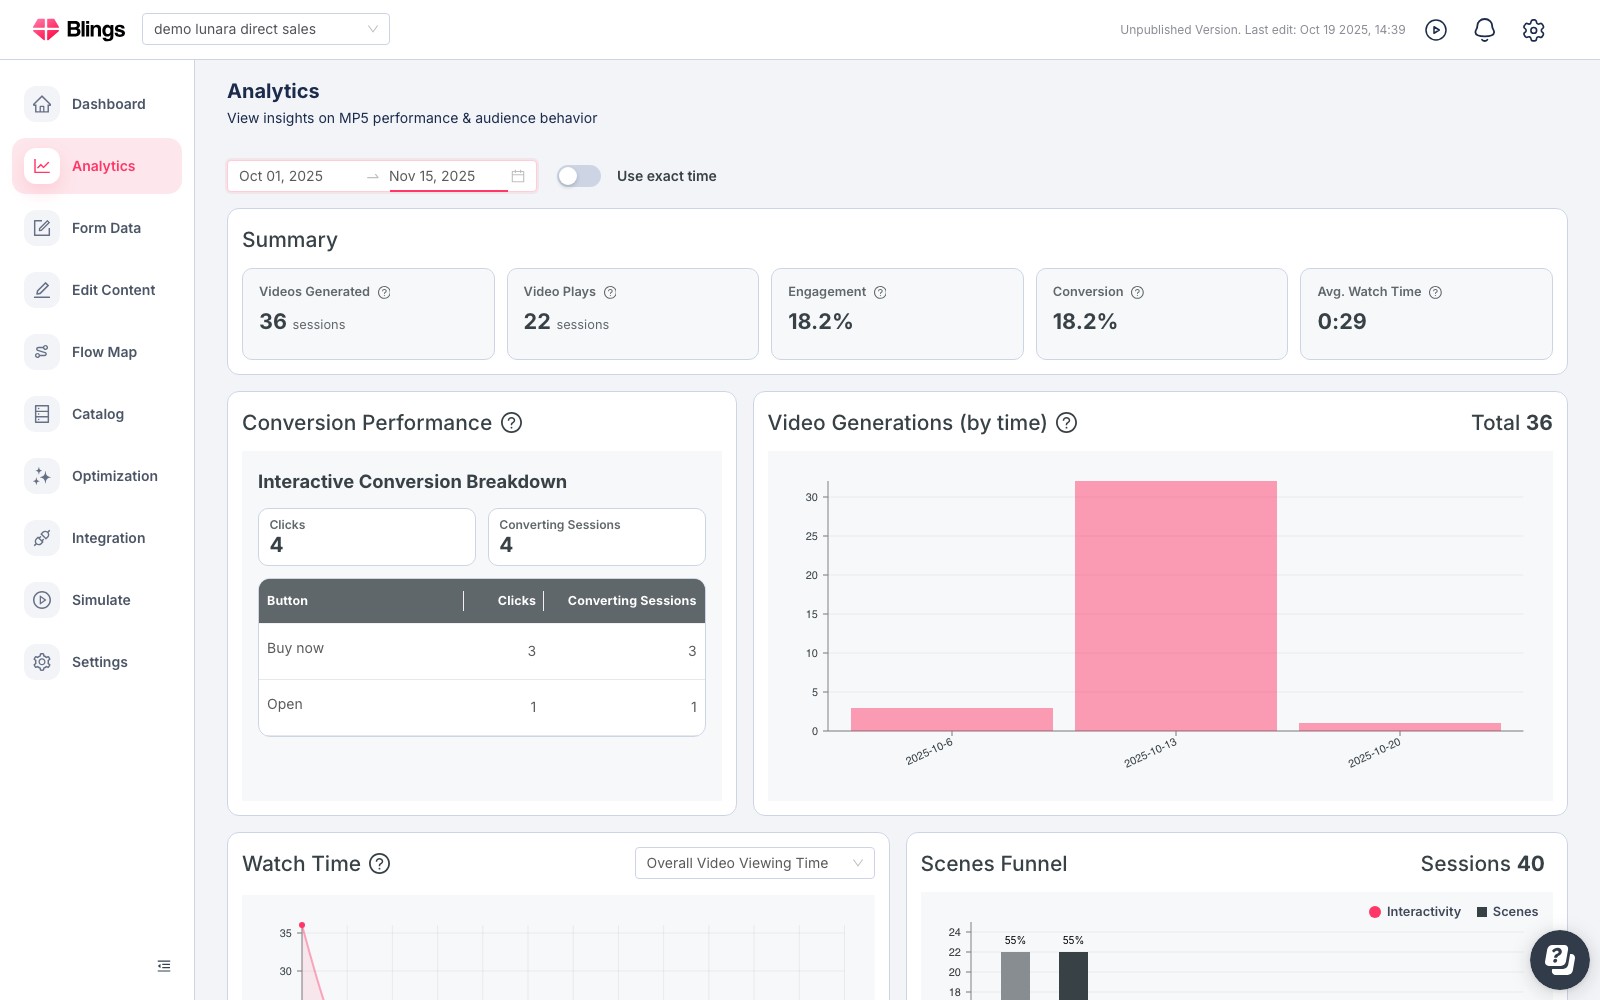
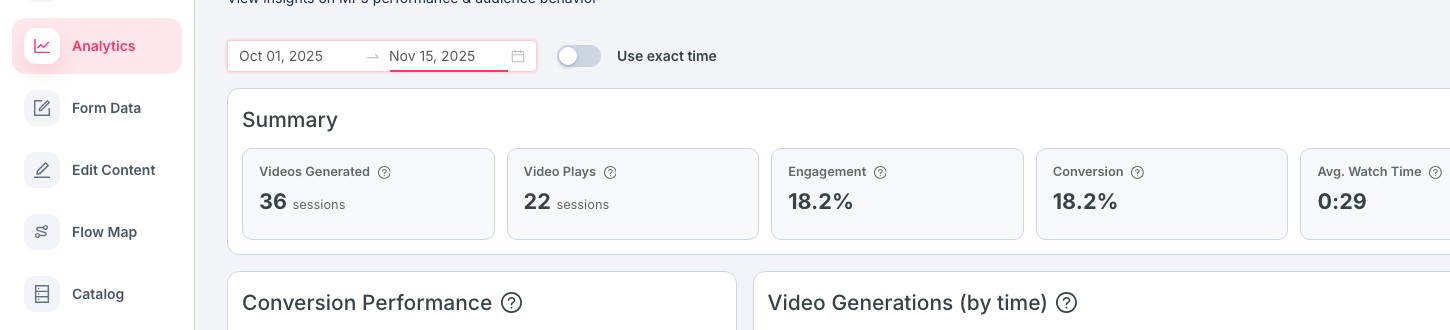
Analytics turns project activity into measurable signals. The view includes a date range selector, an exact-time option, summary cards, and charts for video generation and watch time.
The primary metrics are:
* **Videos Generated** - sessions where a personalized MP5 was generated.
* **Video Plays** - sessions where playback started.
* **Engagement** - interaction and viewing engagement across the project.
* **Conversion** - configured success activity for the experience.
* **Avg. Watch Time** - average time watched across sessions.
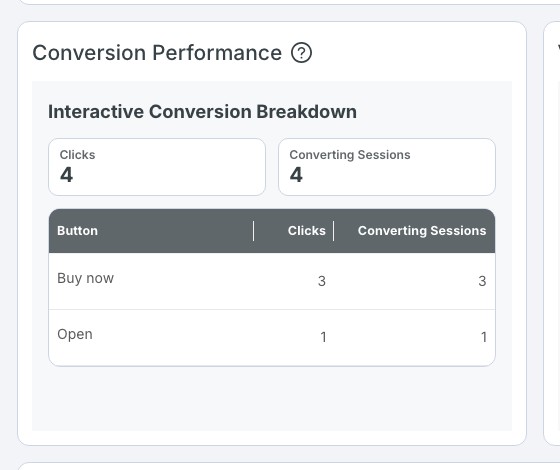
Conversion Performance breaks down the viewer actions that count toward conversion. The table shows each button or interaction, total clicks, and how many sessions converted through that action.
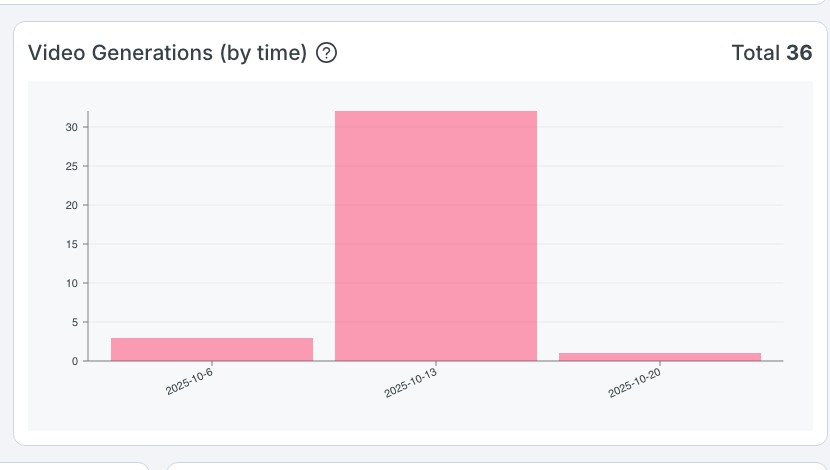
The generation chart shows how creation volume is distributed across the selected date range, which helps separate one-off traffic spikes from sustained project usage.
{% endtab %}
{% endtabs %}
## Metric Reference
Use the dashboard for a fast project-health read and Analytics for a time-window review. Read the metrics together: delivery volume, playback, engagement, conversion, and watch time describe different parts of the same viewer journey.
| Metric | What it means | How to use it |
| ---------------------- | ---------------------------------------------------------------------------------------------------- | ---------------------------------------------------------------------------------------------------------------------------------------------------- |
| **Videos Generated** | Sessions where Platform generated a personalized MP5 experience for the project. | Use it as the top-of-funnel activity signal. If generated videos are low, check delivery, traffic, and data availability before changing content. |
| **Video Plays** | Sessions where playback started. | Compare it with generated videos to see whether viewers are starting the MP5 after it loads. |
| **Engagement** | Viewer interaction and viewing activity across the project. | Use it to understand whether viewers are interacting with the MP5, not only whether they reached the page. Review it with watch time and conversion. |
| **Conversion** | Sessions where a configured success action occurred, such as a selected CTA click or submitted form. | Use it only after the project has a clear conversion setup. A missing or incorrect setup can make conversion appear low or empty. |
| **Avg. Watch Time** | Average time watched across playback sessions. | Use it to diagnose whether viewers stay long enough to reach the message, interaction, or CTA. |
| **Clicks** | Total clicks on an interaction shown in Conversion Performance. | A viewer may click more than once, so clicks can be higher than converted sessions. |
| **Converted sessions** | Sessions that converted through the listed action. | Use it with clicks to separate repeated clicking from unique converting sessions. |
{% hint style="info" %}
Analytics is designed for aggregate project performance. Do not use Platform analytics as a substitute for CRM identity records, form-submission records, or a customer-owned BI export when the review needs person-level attribution.
{% endhint %}
## Conversion Setup
Conversion reporting is useful only when the success action is defined before the review window starts. Agree on the main business outcome, configure the interaction that represents it, then publish the setup before launch traffic arrives.
{% stepper %}
{% step %}
### Define the Success Action
Choose the action that counts as success for this project. Common examples are `Reorder now`, `Book a demo`, `Submit form`, `Continue to checkout`, or another high-intent CTA.
{% endstep %}
{% step %}
### Name the Interaction in Studio
For clickable or submitted actions, open the relevant Studio connector and give the action a readable analytics name. The name should describe the business action, not only the layer name.
{% endstep %}
{% step %}
### Select Main CTA Buttons When Optimizing for Conversion
When the project uses conversion-focused AI Optimization, open Platform Optimization and select the Main CTA buttons that should count as the conversion target. Do not select every clickable action; low-intent navigation can be useful engagement, but it should not always count as conversion.
{% endstep %}
{% step %}
### Publish and Test the Current Setup
Save and publish the Studio or Platform changes, then test the published path with representative data. Confirm the CTA appears in the MP5, performs the expected action, and is visible in the analytics review window after real or test traffic is received.
{% endstep %}
{% endstepper %}
{% content-ref url="/pages/EmZktWe8K8JmCFOB3ynU" %}
[AI Optimization](/apps/blings-platform/ai-optimization.md)
{% endcontent-ref %}
## Date Range and Timezone Behavior
The Analytics date range controls the summary cards, conversion table, and charts. Use **Exact Time** when the review depends on a precise launch, send, incident, or before-and-after comparison.
Keep the reporting window consistent:
* Align Platform, CRM, email-send, SDK, and BI reviews to the same reporting timezone.
* Use exact start and end times when comparing a published change against traffic before the change.
* Treat the current day as incomplete while traffic is still arriving.
* Record the date range, exact time setting, timezone, project, selected lineup, and conversion definition in performance reports.
* When a campaign crosses regions, agree on the reporting timezone before launch so late-night events are not counted in different days across tools.
## Exports and External Reporting
Use Platform Analytics for operational review inside the project. When the data needs to leave Platform, choose the export path that matches the question:
| Need | Recommended path |
| ---------------------------------------------------------- | ----------------------------------------------------------------------------------------------------------------------------------------------------------------------------------------------- |
| Share a project-performance snapshot | Export or copy the available Analytics table or report data for the selected date range when the control is available for the project. Include the date range and timezone in the report notes. |
| Review submitted form values | Use **Form Data** export for form submissions when form collection is enabled. |
| Compare Blings behavior with CRM, product analytics, or BI | Configure custom analytics through the SDK so events are sent to the customer-owned analytics tool. |
| Investigate viewer-level follow-up | Use the CRM, form-submission system, or customer data warehouse that owns viewer identity and consent. Platform analytics should remain the aggregate performance source. |
{% content-ref url="/pages/tcTMJOKSy05H4hRxVQ8F" %}
[Data, Catalog, and Forms](/apps/blings-platform/data-catalog-and-forms.md)
{% endcontent-ref %}
{% content-ref url="/pages/gkZ0caAxmE33rt96vzk8" %}
[Custom Analytics](/role-guides/developer/getting-started/advanced-topics/custom-analytics.md)
{% endcontent-ref %}
## Troubleshooting
| Symptom | What to check |
| ---------------------------------------------------------- | ------------------------------------------------------------------------------------------------------------------------------------------------------------------------------------------------------------ |
| Generated videos are lower than expected. | Confirm the delivery URL, CRM link, SDK project ID, selected lineup, and date range. Check whether the campaign actually sent traffic during the selected window. |
| Videos are generated but plays are low. | Check landing-page load, autoplay expectations, player preview, browser restrictions, and whether viewers need to press play. Compare with the delivery channel's click data. |
| Conversion is empty or unexpectedly low. | Confirm the CTA or form action is named, published, selected as a Main CTA when conversion optimization is used, and included in the selected date range. Test the published path, not only a draft preview. |
| Clicks are higher than converted sessions. | A viewer can click the same interaction more than once. Use converted sessions for session-level conversion and clicks for total interaction volume. |
| Platform numbers do not match CRM or BI. | Compare event definitions, timezone, date boundaries, filters, bot or test traffic, and whether external analytics is receiving the same player events. |
| A change appears to hurt performance. | Compare the same lineup, date window, traffic source, and conversion definition before and after publish. Use Simulation and Edit Content or Flow Map to inspect the changed content or route. |
| Analytics remains unavailable for a custom implementation. | Confirm that analytics collection is enabled for the delivery method. Some highly restricted implementations or customer-owned analytics setups may send events only to the external tool. |
## Performance Review Flow
{% stepper %}
{% step %}
### Start from Workspace Overview
Check the dashboard performance cards and the current player preview. This confirms whether the project is receiving traffic and whether the default preview experience still looks correct.
{% endstep %}
{% step %}
### Open Analytics
Use the Analytics page when the dashboard numbers need time-based context. Select a date range and enable exact time when the review needs a precise window.
{% endstep %}
{% step %}
### Compare Summary Metrics
Read generated videos, plays, engagement, conversion, and average watch time together. A drop in plays can indicate delivery or audience reach; a drop in engagement can indicate content, flow, or player behavior.
{% endstep %}
{% step %}
### Follow the Signal
Move from Analytics into the relevant workspace area: Edit Content for copy/media issues, Flow Map for routing issues, Integration for delivery issues, Simulate for data-specific checks, or Settings for player behavior.
{% endstep %}
{% endstepper %}
{% content-ref url="/pages/aciZDfpMRgUstIteiN90" %}
[Edit Content](/apps/blings-platform/content-and-flow.md)
{% endcontent-ref %}
{% content-ref url="/pages/o3Uq9AhtjBVAMsxuyMFA" %}
[Flow Map basics](/apps/blings-platform/flow-map.md)
{% endcontent-ref %}